Activity, Mobility, and Movement: How much is my animal moving around?
EthoVision provides many dependent variables to measure different aspects of your animal's behavior. Activity, Mobility, and Movement each provide ways to measure the amount of time the animal was moving around vs the amount of time the animal was stationary. Depending on the settings and the context of the experiment, they can be used to measure sleep (prolonged inactivity) or freezing (brief inactivity), or even to identify possible seizure events (usually a brief bout of intense activity). Activity and Mobility can also be used to measure swimming vs floating in the Porsolt Forced Swim Test.
Each of these dependent variables has a continuous measure that reports a value for every sample point, and a state measure that compares that value to a threshold. Activity is a continuous measure, while Activity State is the state measure. Mobility and Mobility State have the same relationship. Movement is a state measure based on the continuous value of Velocity.
Mobility
Mobility looks at the entire area that is detected as the animal – everything that is showing up in yellow during tracking. It asks what percentage of that area is different (non-overlapping) from one sample to the next. The Mobility could be high either because the animal is moving (e.g. in a straight line), or because the outline of the animal is changing (e.g. the animal is rotating in place so the head and tail are in different places even though the center point might be stationary). Mobility reports a percentage which is the percentage change.
Here's how that change is calculated. A(n-1) is the area of the animal in the previous sample point, while A(n) is the area in the current sample point. CA(n) is the calculated changed area.

Mobility States then compares that percentage to the thresholds you set in order to categorize mobility as immobile, mobile, or highly mobile and give you the duration and frequency of each state. In the example shown below, the animal is considered Immobile when the mobility is below 4%, mobile from 4-10%, and highly mobile from 10% up.

Activity
Activity does not care what is detected as the animal. Instead, it looks at the entire arena and asks what percentage of the entire arena is changing. Of course we expect that what is changing is either the animal or directly caused by the animal (e.g. shadows or reflections caused by the animal), but for these purposes we’re just asking what percentage of pixels in the arena are different than in the previous sample. Activity States then compares that percentage to thresholds you set, the same way as Mobility is used to determine Mobility States.
When the detection settings are good and the whole body of the animal is being detected (and showing in yellow), Mobility and Activity are equally good and should give very similar results (the values will not be the same but they will show the same differences between treatments etc). Activity does require that it must be enabled in the Experiment Settings and the settings adjusted in the Detection Settings in order for it to be used, whereas Mobility is something you can add post-hoc.
When it’s difficult to get good detection settings, and only part of the animal is detected inconsistently, or you are inconsistently picking up shadows and reflections as part of the animal, Activity can be a better choice. Activity can also work in situations where tracking is not possible at all, e.g. you could look at activity in the whole tank when there are too many fish to track individually.
To set up Activity, before running any trials and after checking the Activity checkbox in the experiment settings, in the Detection Settings click Activity on the right. You will see these settings:
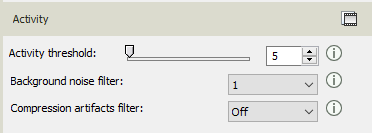
Set the Compression Artifacts Filter on if you are using video files. Set it off if you are acquiring trials directly from a camera.
The background noise filter can be helpful if you see a lot of activity all over the arena due to camera noise. You will also need to adjust the activity threshold after changing the background noise filter.
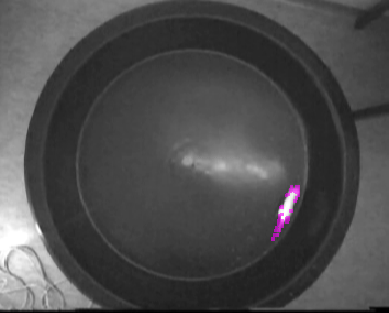
Adjust the activity threshold so that you see purple wherever there is movement in the arena, but minimize the amount of purple where there is no movement. It may look something like this:
Movement
Movement is the simplest measure. It simply determines whether the center point of the animal's body (or other selected point) was moving faster than a threshold you set. The settings look like this:
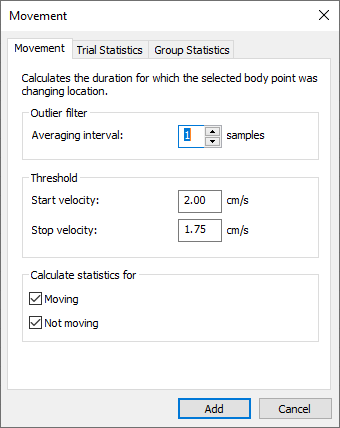
In this case, as soon as the animal begins moving at least 2.00 cm/s, it is considered moving. When its velocity drops below 1.75 cm/s, it is considered to have stopped ("not moving").
Movement tells you how often the animal was walking around. However, because it only looks at whether that center point was going from one place to another, it won't distinguish between an animal that is completely stationary (e.g. freezing, sleeping) and one that is sitting in place but active (e.g. grooming).
Determining Thresholds
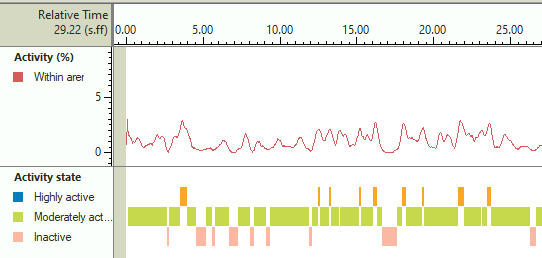
Mobility State, Activity State, and Movement all depend on determining appropriate thresholds. The optimal threshold depends on your animals, your arena, and your settings, so you will need to examine your data to determine what threshold to use. The easiest way to do this is by using the Integrated Visualization. First add Velocity, Mobility, and/or Activity to your analysis profile – these are the three measures that will be used to determine Movement, Mobility States, and Activity States. Then go to the Integrated Visualization. Here, you will see your video with the track superimposed, and also plots of those three dependent variables. You can zoom in and out by picking the + and – magnifying glasses at the top, then click in the graph to zoom the timeline in and out, or click in the Y-axis to adjust that scale. You can check specific values at any point along the plots by hovering the mouse over those points. Here's an example of Activity and Activity States:
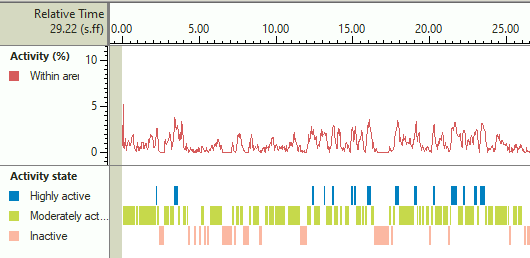
For Mobility and Activity, you may find that the plots are very noisy. You can go back to the analysis profile and double-click them to edit the settings, then raise the Averaging Interval to remove some of that noise. That will convert the values to moving averages over the specified number of samples. Here's that same data averaging over 10 samples:
Now look at periods with the behavior of interest (e.g. freezing, sleeping, active, seizures -- whatever you want to identify) and find thresholds that distinguish those periods from baseline behavior. Set up Movement, Mobility States, and Activity States accordingly. If you raised the Averaging Interval for Mobility, be sure to set it the same way for Mobility States, and likewise for Activity and Activity States. Then look at the integrated visualization again. Do the states correspond well with your behavior? You can adjust the thresholds up and down as needed.
For Activity States, you can also exclude very short intervals (in the Activity States settings), if the behavior you are looking for is not brief (e.g. sleeping).