Can I get certain dependent measures (e.g., "distance moved") by zone in EthoVision XT?
It's possible to calculate any dependent variable in your Analysis Profile by zone(s). For example, you can get the “Distance Moved” within each quadrant zone in a Morris Water Maze study. This will reveal how much of the animal's total path length was in each of the quadrants.
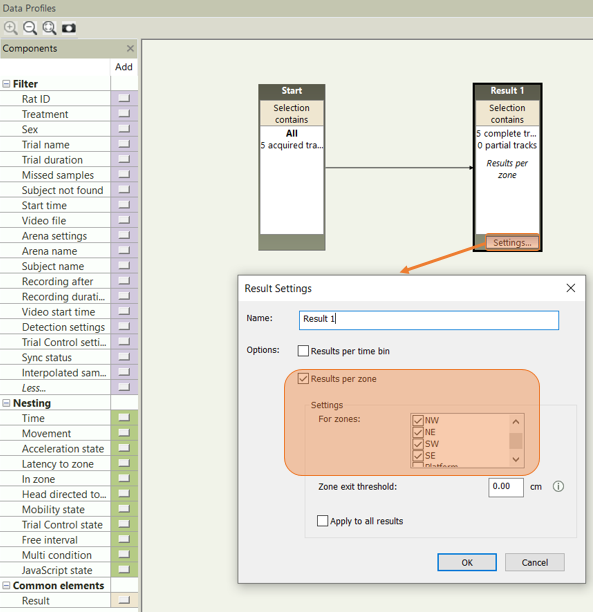
Solution: Use the “Results per zone” option in the Result(s) container.
In your Data Profile, click on the “Settings” button for the Results container(s), check the “Results per zone” button, and check the zone(s) of interest that you would like to have the Dependent Measure(s) of interest in your Analysis Profile for that zone(s).

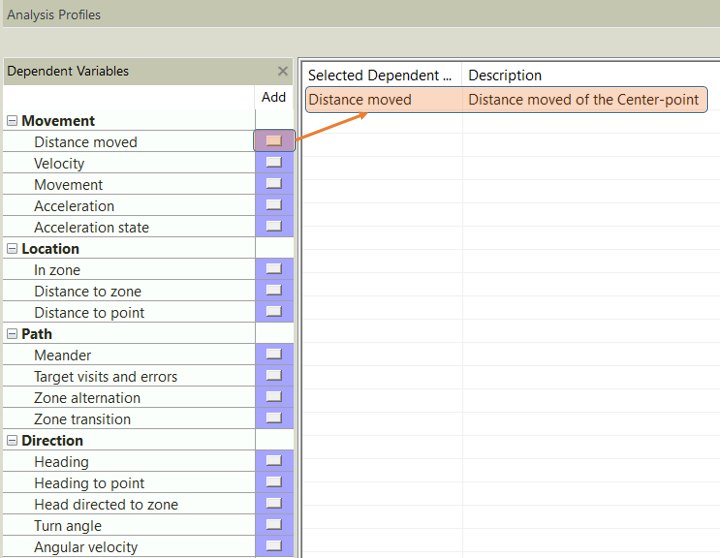
Once finished in the Data Profile, go to your Analysis Profile and add the Dependent Measure(s) of interest (e.g., “Distance moved”).

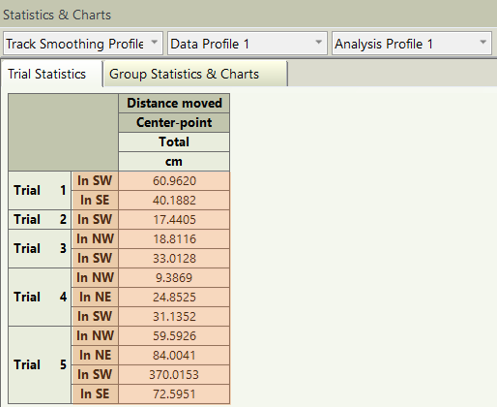
After adding the Dependent Measure(s) of interest in the Analysis Profile, go to Statistics & Charts and you should see the data broken down by zone(s).
